
Tesla Stock Price Data Analysis
- Priank Ravichandar
- Aug 26, 2024
- 5 min read
Updated: Nov 8, 2025
Creating an enhanced AI-assisted workflow to examine Tesla Inc. (TSLA) stock price performance over a 4-year period.

Context
Investors often use a company’s financial performance to evaluate investment decisions. The average individual investor does not have access to sophisticated tools to evaluate stock performance and understand the implications of different trends. This project explores how AI can be applied to analyze and contextualize stock performance, helping us understand how a company has been doing, so they can make informed investment decisions. As an example, we analyze the Tesla stock (TSLA) during a 4-year period (2021-2024) to evaluate and understand the trends leading up to December 2024, when the stock price reached an all-time peak.
Improving The Data Analysis Insights
We have previously analyzed a dataset using R and extracted certain insights. We want to use AI to enhance the data analysis, so we can uncover useful new information. We also want to use the model’s search capabilities to add useful context to the stock performance insights from the data analysis.
There are four ways in which we can apply AI to accomplish this:
Enhanced Analysis: The AI model was instructed to review the data analysis in R, replicate the analysis in Python, and draw new conclusions based on the results of this analysis. The goal was to reveal interesting patterns, observations, or details that were initially overlooked.
Automated Analysis: The AI model was instructed to review the dataset and generate a new analysis from scratch. The goal was to improve the quality of insights obtained by giving the model complete freedom to conduct the analysis, without being influenced by the existing analysis, and to contextualize the observed trends using relevant data from news sources. We used the same prompt and the same model (Sonnet 4.5) across three different tools: Claude, Perplexity, and Perplexity Research.
Note:
In all four cases, the AI-generated output will be manually refined as well.
We chose Perplexity since it has an inbuilt financial analysis and contextualization capabilities.
Input Files
We can provide the following files as context for the AI:
Data Analysis: An R Notebook containing a previous data analysis on Tesla stock data, along with details about the dataset, the analysis methodology, data analysis results, visualizations, and insights.
Objective
The overall objective is to identify a data analysis AI workflow that can be used to understand a stock’s performance, especially around noteworthy periods (e.g., historic highs or lows). We also want to understand how the AI tool chosen influences the quality of outputs, even when using the same prompt and the same model.
Workflow
Tools: Claude, Perplexity
Note: The analysis will require both Claude Pro and Perplexity Pro.
Step 1: Conduct Enhanced Analysis
Step 1A: Craft a data analysis prompt
We construct an initial prompt with basic requirements. We optimize this prompt using meta prompting with Claude Sonnet 4.5. We review and refine the generated prompt as needed. Refer to my meta prompting resource for more details on how to do this.
Note: Since most AI models use Python for analysis, we create a Python Notebook with a comparable analysis. The model only highlights observed trends and enhances the quality of the markdown documentation, but it does not change the general analysis methodology.
Step 1B: Conduct data analysis
We run the optimized prompt using Claude Sonnet 4.5 to review the existing data analysis and generate new insights. We review and refine the AI-generated output as needed.
Outputs
Note: The initial and optimized analysis prompts can be found here.
Step 2: Conduct Automated Analysis
Step 2A: Craft a data analysis prompt
We construct an initial prompt with basic requirements. We optimize this prompt using meta prompting with Claude Sonnet 4.5. We review and refine the generated prompt as needed. Refer to my meta prompting resource for more details on how to do this.
Note: We are using the same prompt and the same model (Claude Sonnet 4.5) for each automated analysis. We want to understand how the choice of tool influences the output.
Step 2B: Stock analysis using Claude
We run the optimized prompt in Claude (with Sonnet 4.5) to review the dataset and generate insights. We also convert the Python code used by Claude into a Python Notebook. We review and refine the AI-generated output as needed.
Outputs
Note: The initial and optimized analysis prompts and Python Notebook generation prompt can be found here.
Step 2C: Stock analysis using Perplexity
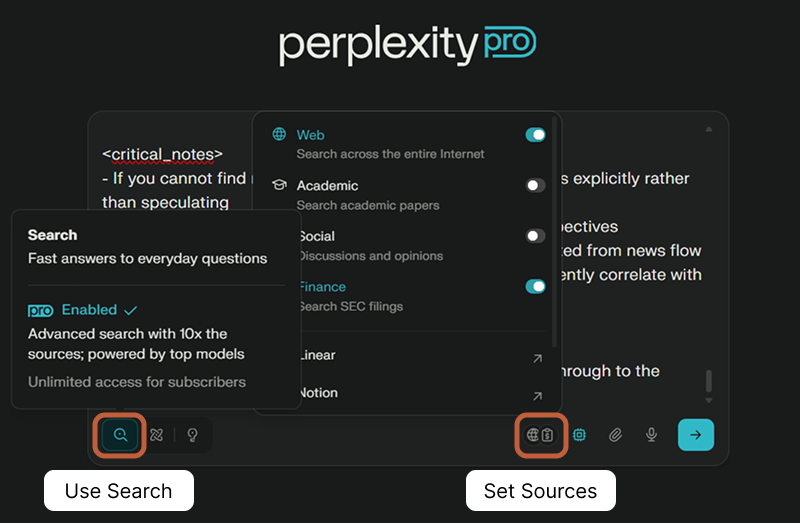
We run the optimized prompt in Perplexity (with Sonnet 4.5) to review the dataset and generate insights. We set the Sources to Web and Financial. We review and refine the AI-generated output as needed.


Outputs
Note:
Perplexity Finance gives you conversational context on stock performance, but does not allow you to upload a file for analysis. So, we just use a normal Perplexity chat thread.
The initial and optimized analysis prompts can be found here.
Step 2D: Stock analysis using Perplexity Research
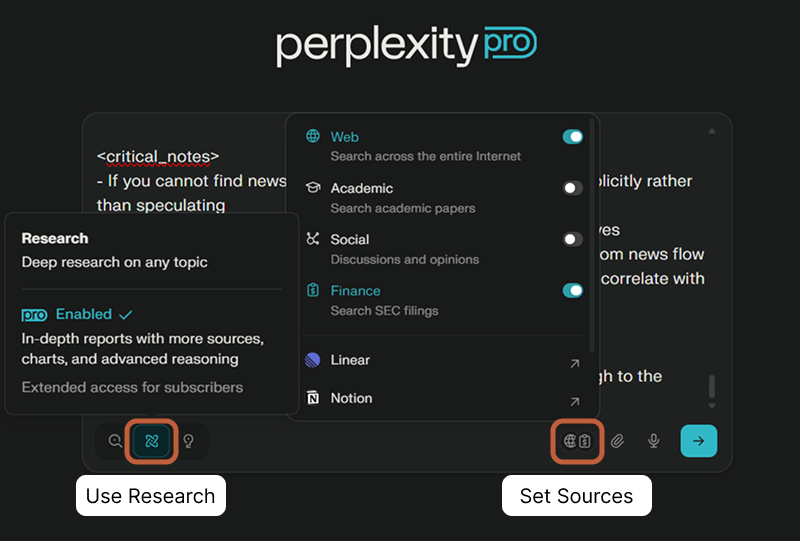
We run the optimized prompt in Perplexity (with Sonnet 4.5) to review the dataset and generate insights. We set the Sources to Web and Financial. We review and refine the AI-generated output as needed.

Outputs
Note:
Perplexity Finance gives you conversational context on stock performance, but does not allow you to upload a file for analysis. So, we just use a normal Perplexity chat thread.
The initial and optimized analysis prompts can be found here.
Step 3: Conduct Comparison
We now have AI-generated insights from the dataset using four different approaches. We can now compare the results to answer the following questions:
How did the quality of insights in each AI approach vary?
Which approach would give a potential investor the greatest insight into the stock performance?
Step 3A: Craft a data analysis comparison prompt
We construct an initial prompt with basic requirements. We optimize this prompt using meta-prompting with Claude Sonnet 4.5. We review and refine the generated prompt as needed. Refer to my meta prompting resource for more details on how to do this.
Step 4B: Conduct data analysis comparison
We run the optimized prompt using Claude Sonnet 4.5 to review the insights generated from each approach. We review and refine the AI-generated output as needed.
Outputs
Note: The initial and optimized analysis prompts can be found here.
Conclusion
We explored how AI-assisted approaches can enhance stock performance analysis insights.
The Enhanced Analysis approach uncovered deep structural and technical patterns (e.g., volatility regime persistence, zero-false-signal 30-day MA) but lacked contextual and causal interpretation.
The Automated Analysis approach delivered deeper insights because of access to news data from web search.
Claude provided the most actionable and causally quantified insights, balancing catalyst weighting, recurring behavioral patterns, and forward-looking sustainability warnings.
Perplexity provided strong clarity and volume-based technical context but limited causation quantification.
Perplexity Research provided unmatched depth and event precision but offered minimal synthesis for investment action.
Strategic Takeaway
Use Claude for real-time decision support and assessing speculative vs. fundamental price drivers.
Use Perplexity for validating intraday dynamics, volume behavior, and contextual event timing.
Use Perplexity Research for due diligence, regulatory documentation, and audit-ready evidence aggregation.